

Free Data Quality Report for Parquet, CSV and Excel Files
Know whether you can trust a dataset before you use it
A data file can look fine in a table view and still hide problems: a column that is half empty, email addresses that are not email addresses, dates written in three different formats, or an ID column with duplicates that will quietly break your next join.
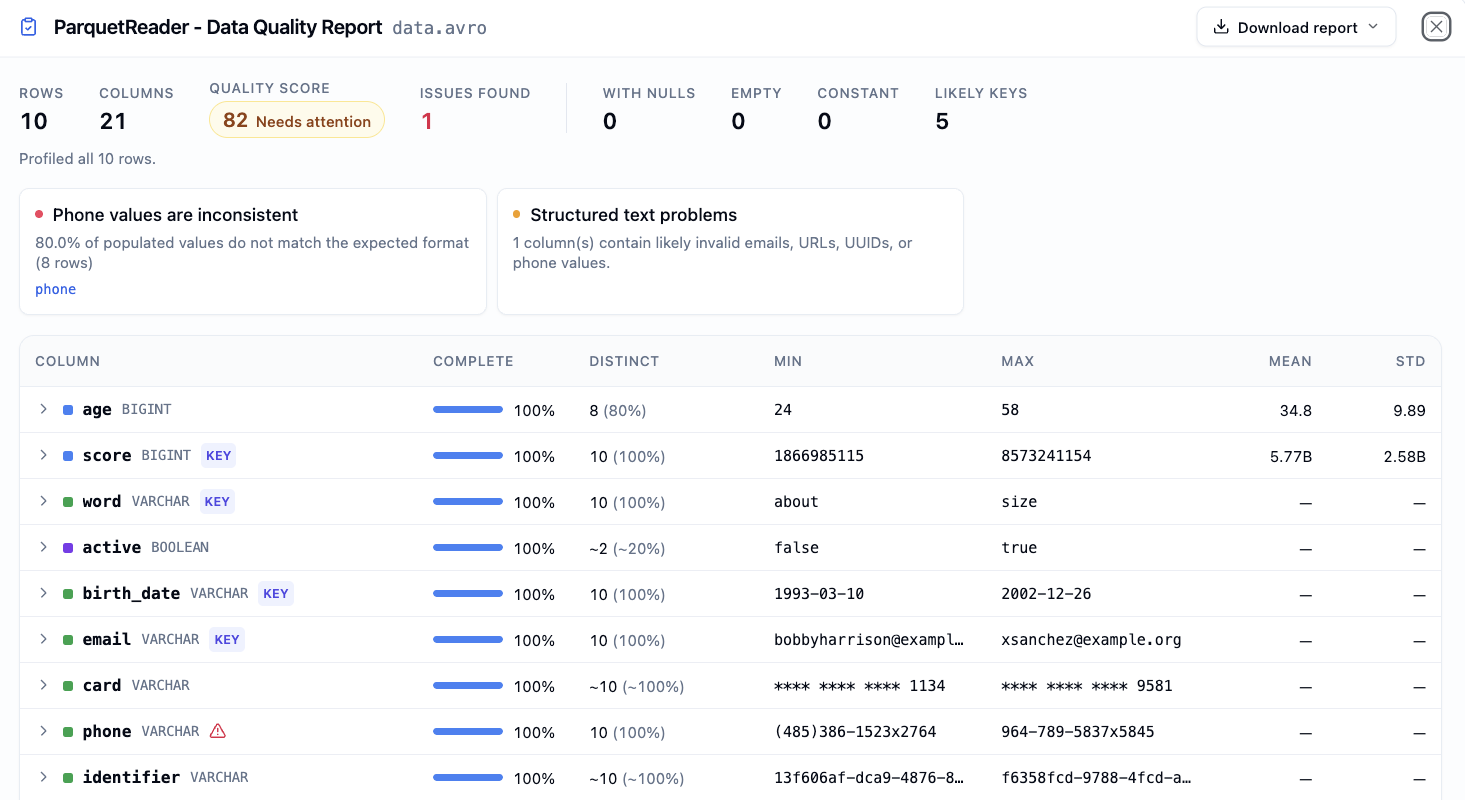
ParquetReader now includes a Data Quality Report. It profiles every column of your dataset, runs a set of quality checks, and summarizes the result in one quality score. It works for every format ParquetReader opens, including Parquet, CSV, Excel, JSON, Avro, ORC, Feather and Vortex.
Like browsing, searching and running SQL, the quality report is free. You do not need an account or a paid plan to use it.
How to open the Data Quality Report
- Upload your file on ParquetReader.
- In the Data Explorer, click Quality report, next to the Export button.
- Review the summary, then expand any column for details.
The report is generated on demand and usually takes only a few seconds. Opening it again shortly afterwards is instant.
The dataset at a glance
The top of the report gives you the overall picture in one line:
- Rows and columns: the size and shape of the dataset.
- Quality score: a score out of 100, labeled Good, Needs attention or Poor.
- Issues found: the number of quality problems, split into critical issues and warnings.
- Columns with nulls: how many columns contain missing values.
- Empty columns: columns without a single value.
- Constant columns: columns where every row has the same value.
- Likely keys: columns where every row has a unique, non-empty value, such as an order ID or a customer email.
Below the summary, the most important findings are shown as short signals. Each signal names the affected column, and clicking it takes you straight to that column in the profile.
A profile of every column
The column profile lists every column with its data type and the statistics that matter for that type:
- Complete: the share of rows that have a value, with a bar that turns amber or red when too many values are missing.
- Distinct: the number of unique values and their share of all rows.
- Min and max: the range of numbers, dates and timestamps, and the alphabetical range of text values.
- Mean and standard deviation: for numeric columns.
To keep the report fast on large files, distinct counts are estimated and marked with a ~. For likely keys and for columns with a quality issue, ParquetReader calculates the exact count.
Columns with a problem get a subtle warning icon, so you can scan a wide schema and immediately see where to look.
Drill into a column
Click a column to expand it. Depending on the column, you will see:
- Quality issues: what is wrong, why it matters, and how many rows are affected.
- Examples: a few of the values that failed a check, so you can see the problem for yourself.
- Top values: the most frequent values and their share of the dataset.
- Distribution: a histogram for numeric columns, together with the 25th percentile, median and 75th percentile.
This is often the quickest way to understand a column you have never seen before, such as a status field with an unexpected value or an amount column with a long tail of outliers.
Which quality checks are included?
The report looks for the problems that most often break exports, joins, dashboards and downstream analysis:
- High null rates: columns where 15% or more of the rows are empty, and critical from 35%.
- Invalid email addresses, URLs, UUIDs and phone numbers: values that do not match the expected format in columns whose names suggest that content.
- Mixed date formats: text columns with a date-like name, such as
created_date, where a significant share of the values cannot be parsed as a date. - Mixed numeric formats: amounts, prices and other numbers stored as text that mix comma and dot decimal notation, such as
12,50and12.50. - Duplicate key values: ID-like columns that are mostly unique but contain repeated values.
- Duplicate rows: rows that appear more than once in the dataset.
Every issue is classified as critical or as a warning, based on how large a share of the data is affected.
How the quality score works
Every dataset starts with a score of 100. Each critical issue and each warning lowers the score, critical issues more than warnings. Missing values also count: the higher the null rate of the emptiest column, the larger the deduction.
A score of 85 or higher is labeled Good, 60 to 84 is Needs attention, and below 60 is Poor.
The score is a quick signal, not a verdict. A column with many nulls can be perfectly valid, for example an optional field. Use the score to decide where to look, and the column details to decide what to do.
Share the report as PNG or JSON
Data quality is rarely a one-person job. Use Download report in the top-right corner of the report to share the result with your team, a supplier or a client:
- Download as PNG: a clean, full-length image of the complete report, designed to be dropped into an email, a Slack or Teams message, or a ticket.
- Download as JSON: a structured, versioned file with the same information, useful for documentation, data contracts and automated pipelines.
The PNG always contains the full dataset profile, not just the part of the report that is visible on your screen.
Safe to forward: aggregates only
A quality report is often sent to people who should not see the underlying data. That is why both downloads contain aggregate statistics only.
Row values, top values and example values are never included. Minimum and maximum values are only included for numbers, dates and booleans, and are left out for text columns, where they would reveal actual values such as names or email addresses.
The result is a report that shows the shape and health of the data without exposing its content. If you need to share the data itself, read our guide on masking sensitive data in Parquet files.
Built for large files
Most column statistics are calculated in a single pass over the data, and the more expensive checks are focused on the columns most likely to contain a problem. This keeps the report fast, even for files with millions of rows.
For very large files, ParquetReader profiles the first part of the file instead of the whole dataset. When that happens, the report states exactly how many rows were included, so you always know what the numbers are based on.
When to run a data quality check
- Before exporting data to a spreadsheet, a customer or another system.
- When you receive a file from a supplier, a partner or another team and want to know what you are dealing with.
- Before loading data into a data warehouse, a BI tool or an AI workflow.
- When a pipeline misbehaves and you want to find empty columns, duplicates or unexpected values quickly.
Once you know where the problems are, you can investigate further with SQL queries on your file, directly in ParquetReader.
Try the Data Quality Report
The Data Quality Report is available now for every file you open in ParquetReader. Upload a Parquet, CSV, Excel, JSON, Avro, ORC or Feather file and click Quality report in the Data Explorer.
Check the quality of your data with ParquetReader
New to the format? Read what Parquet files are, or see the overview of all supported file formats.