

Chat With Your Data Is Live - Talk to Parquet, CSV, Excel, JSON, GeoJSON, NetCDF and More
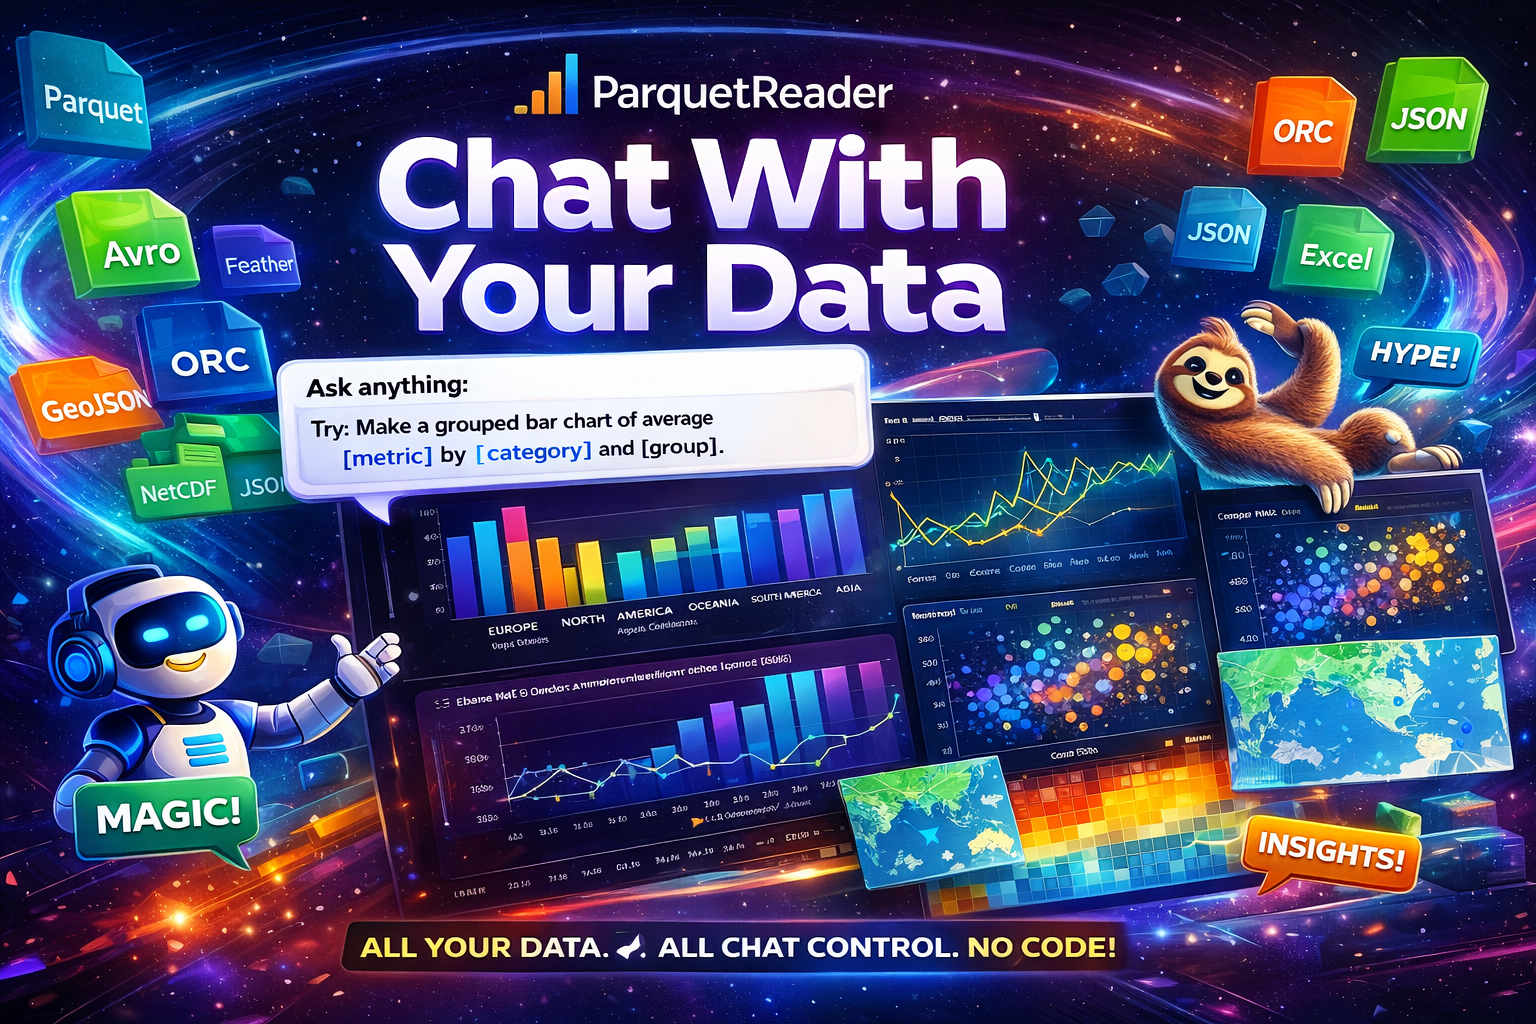
A new way to work with files is here
This is one of the biggest upgrades we have shipped for ParquetReader: Chat with your data is now live.
Upload a file, ask a question in plain English, and get a grounded answer back with SQL, charts, and rows on demand.
And it is not just for Parquet anymore. You can now talk to Parquet, Avro, Feather, ORC, CSV, GeoJSON, NetCDF, JSON, Excel & Arrow in the same clean workflow.
That means fewer tool switches, fewer notebooks, and a much faster path from “what is in this file?” to “show me the answer.”
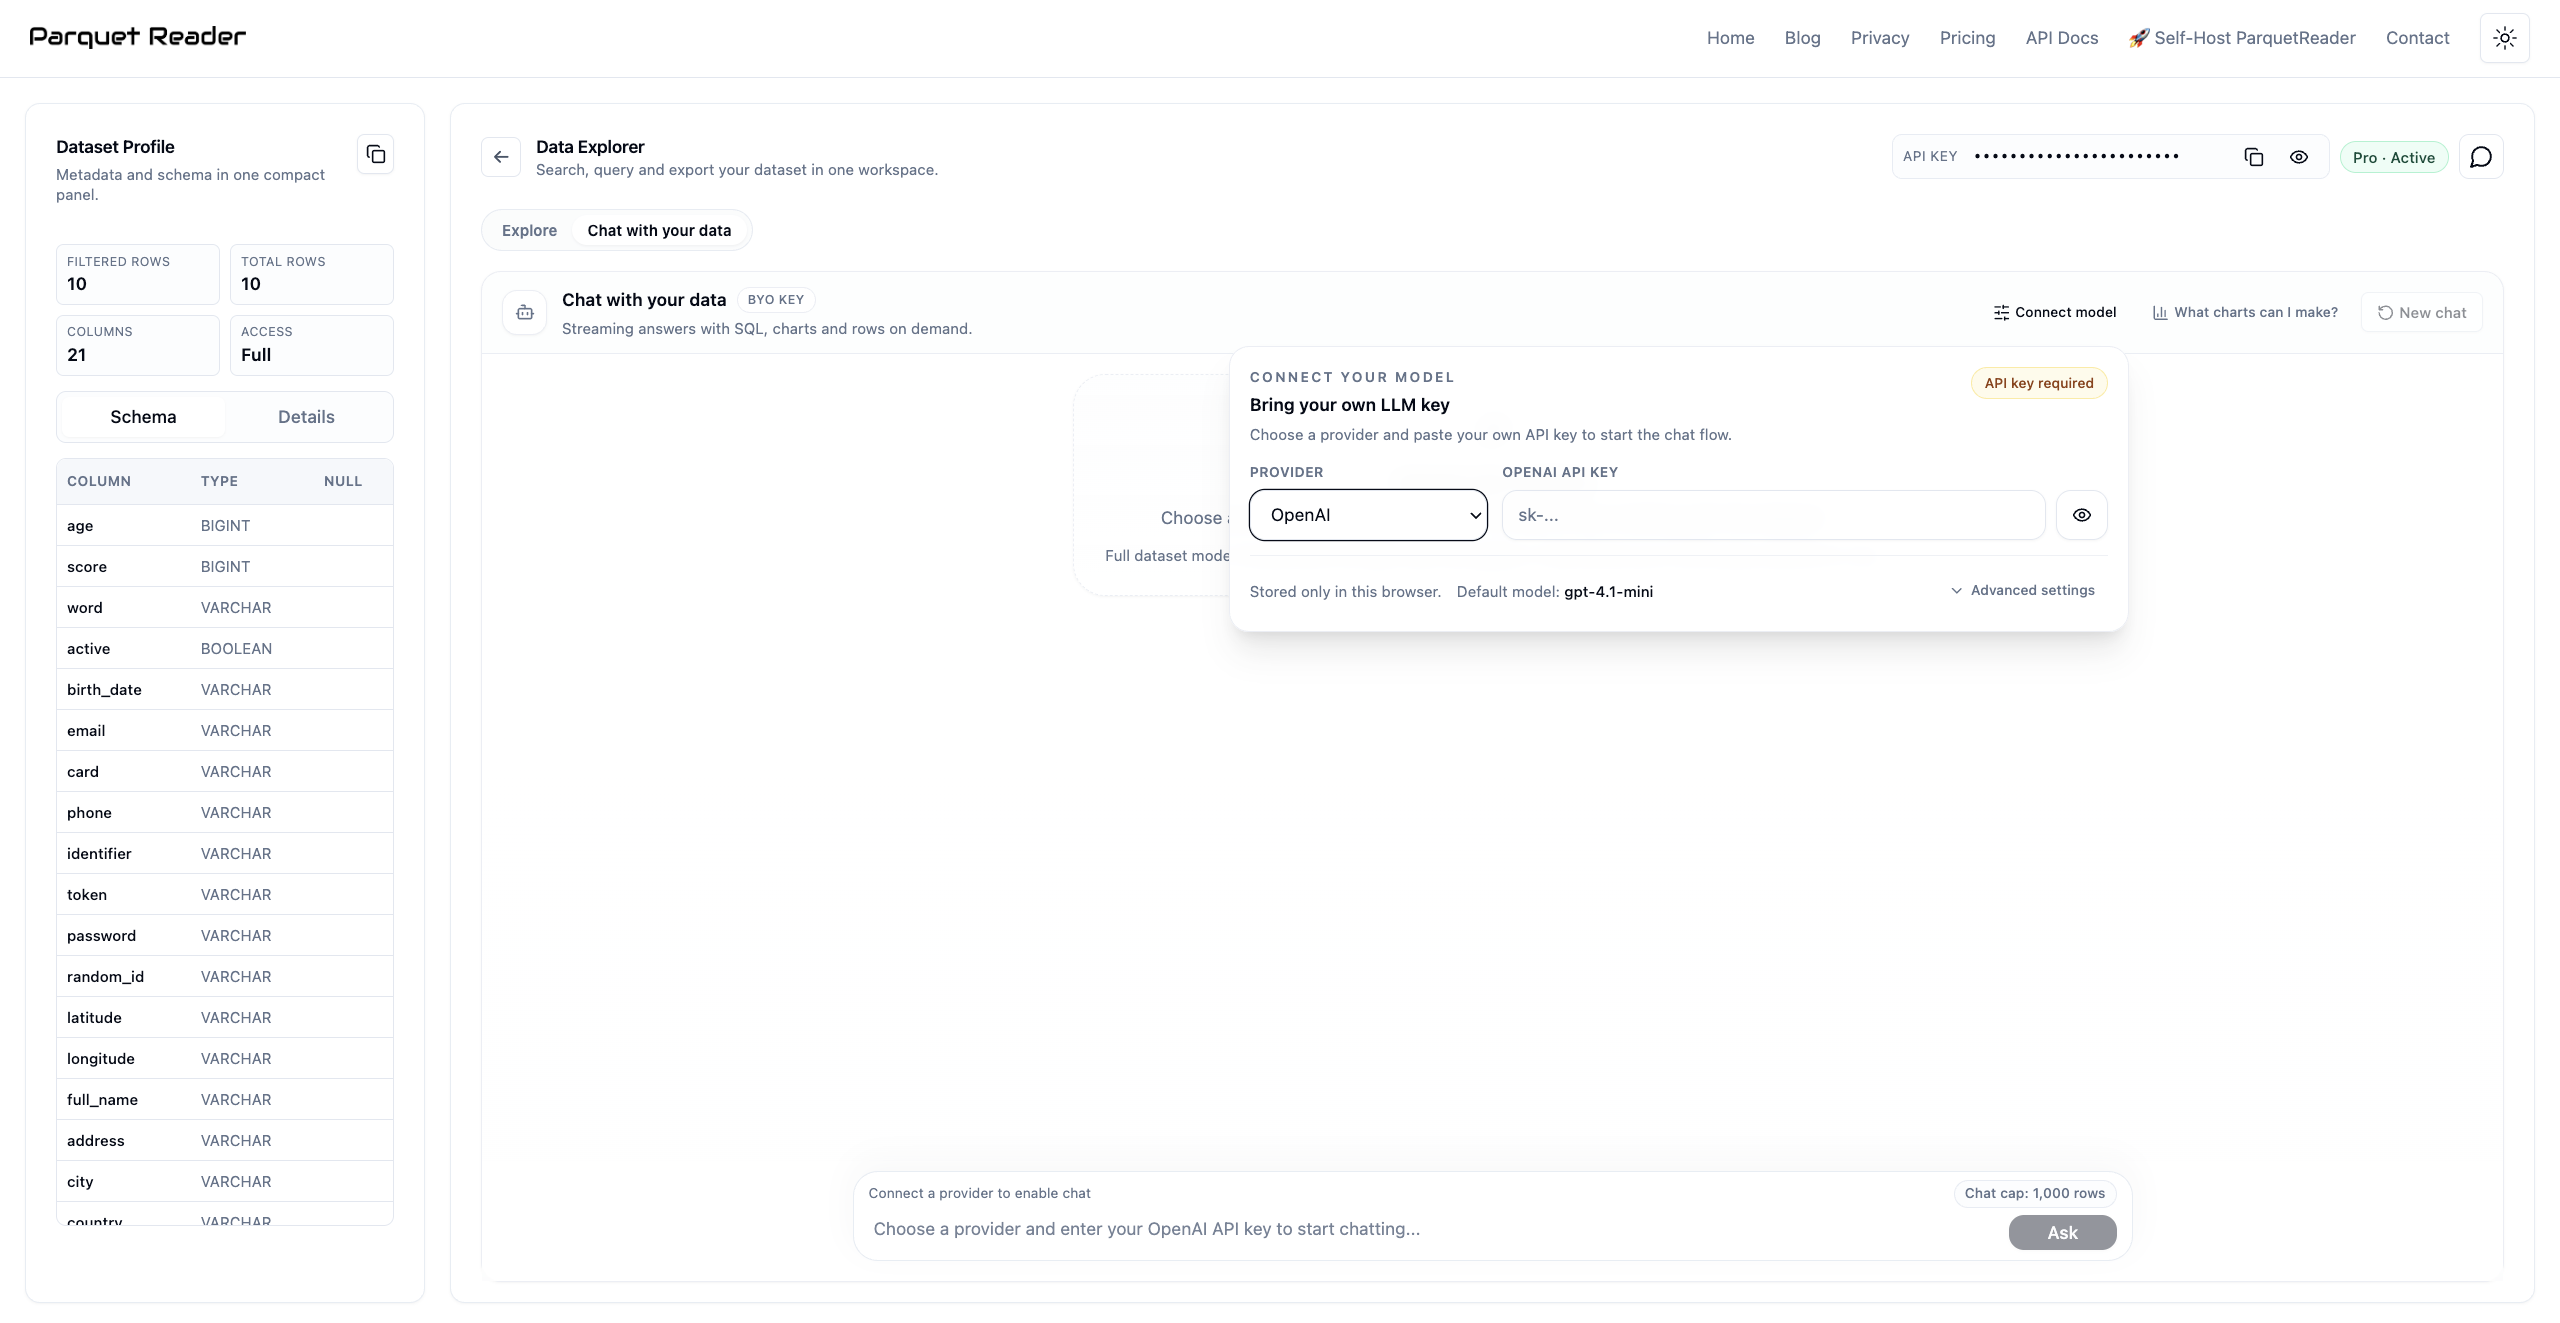
Bring your own model. Keep control of your key.
ParquetReader keeps the setup simple: choose your provider, paste your key, and start chatting. No included AI plan, no hidden model lock-in, no forced migration of your workflow.
You can currently bring your own key for OpenAI, Anthropic, Gemini, and xAI. Free users can try the chat flow on the preview dataset. Paid users can run the same experience against the full dataset, still with their own key.
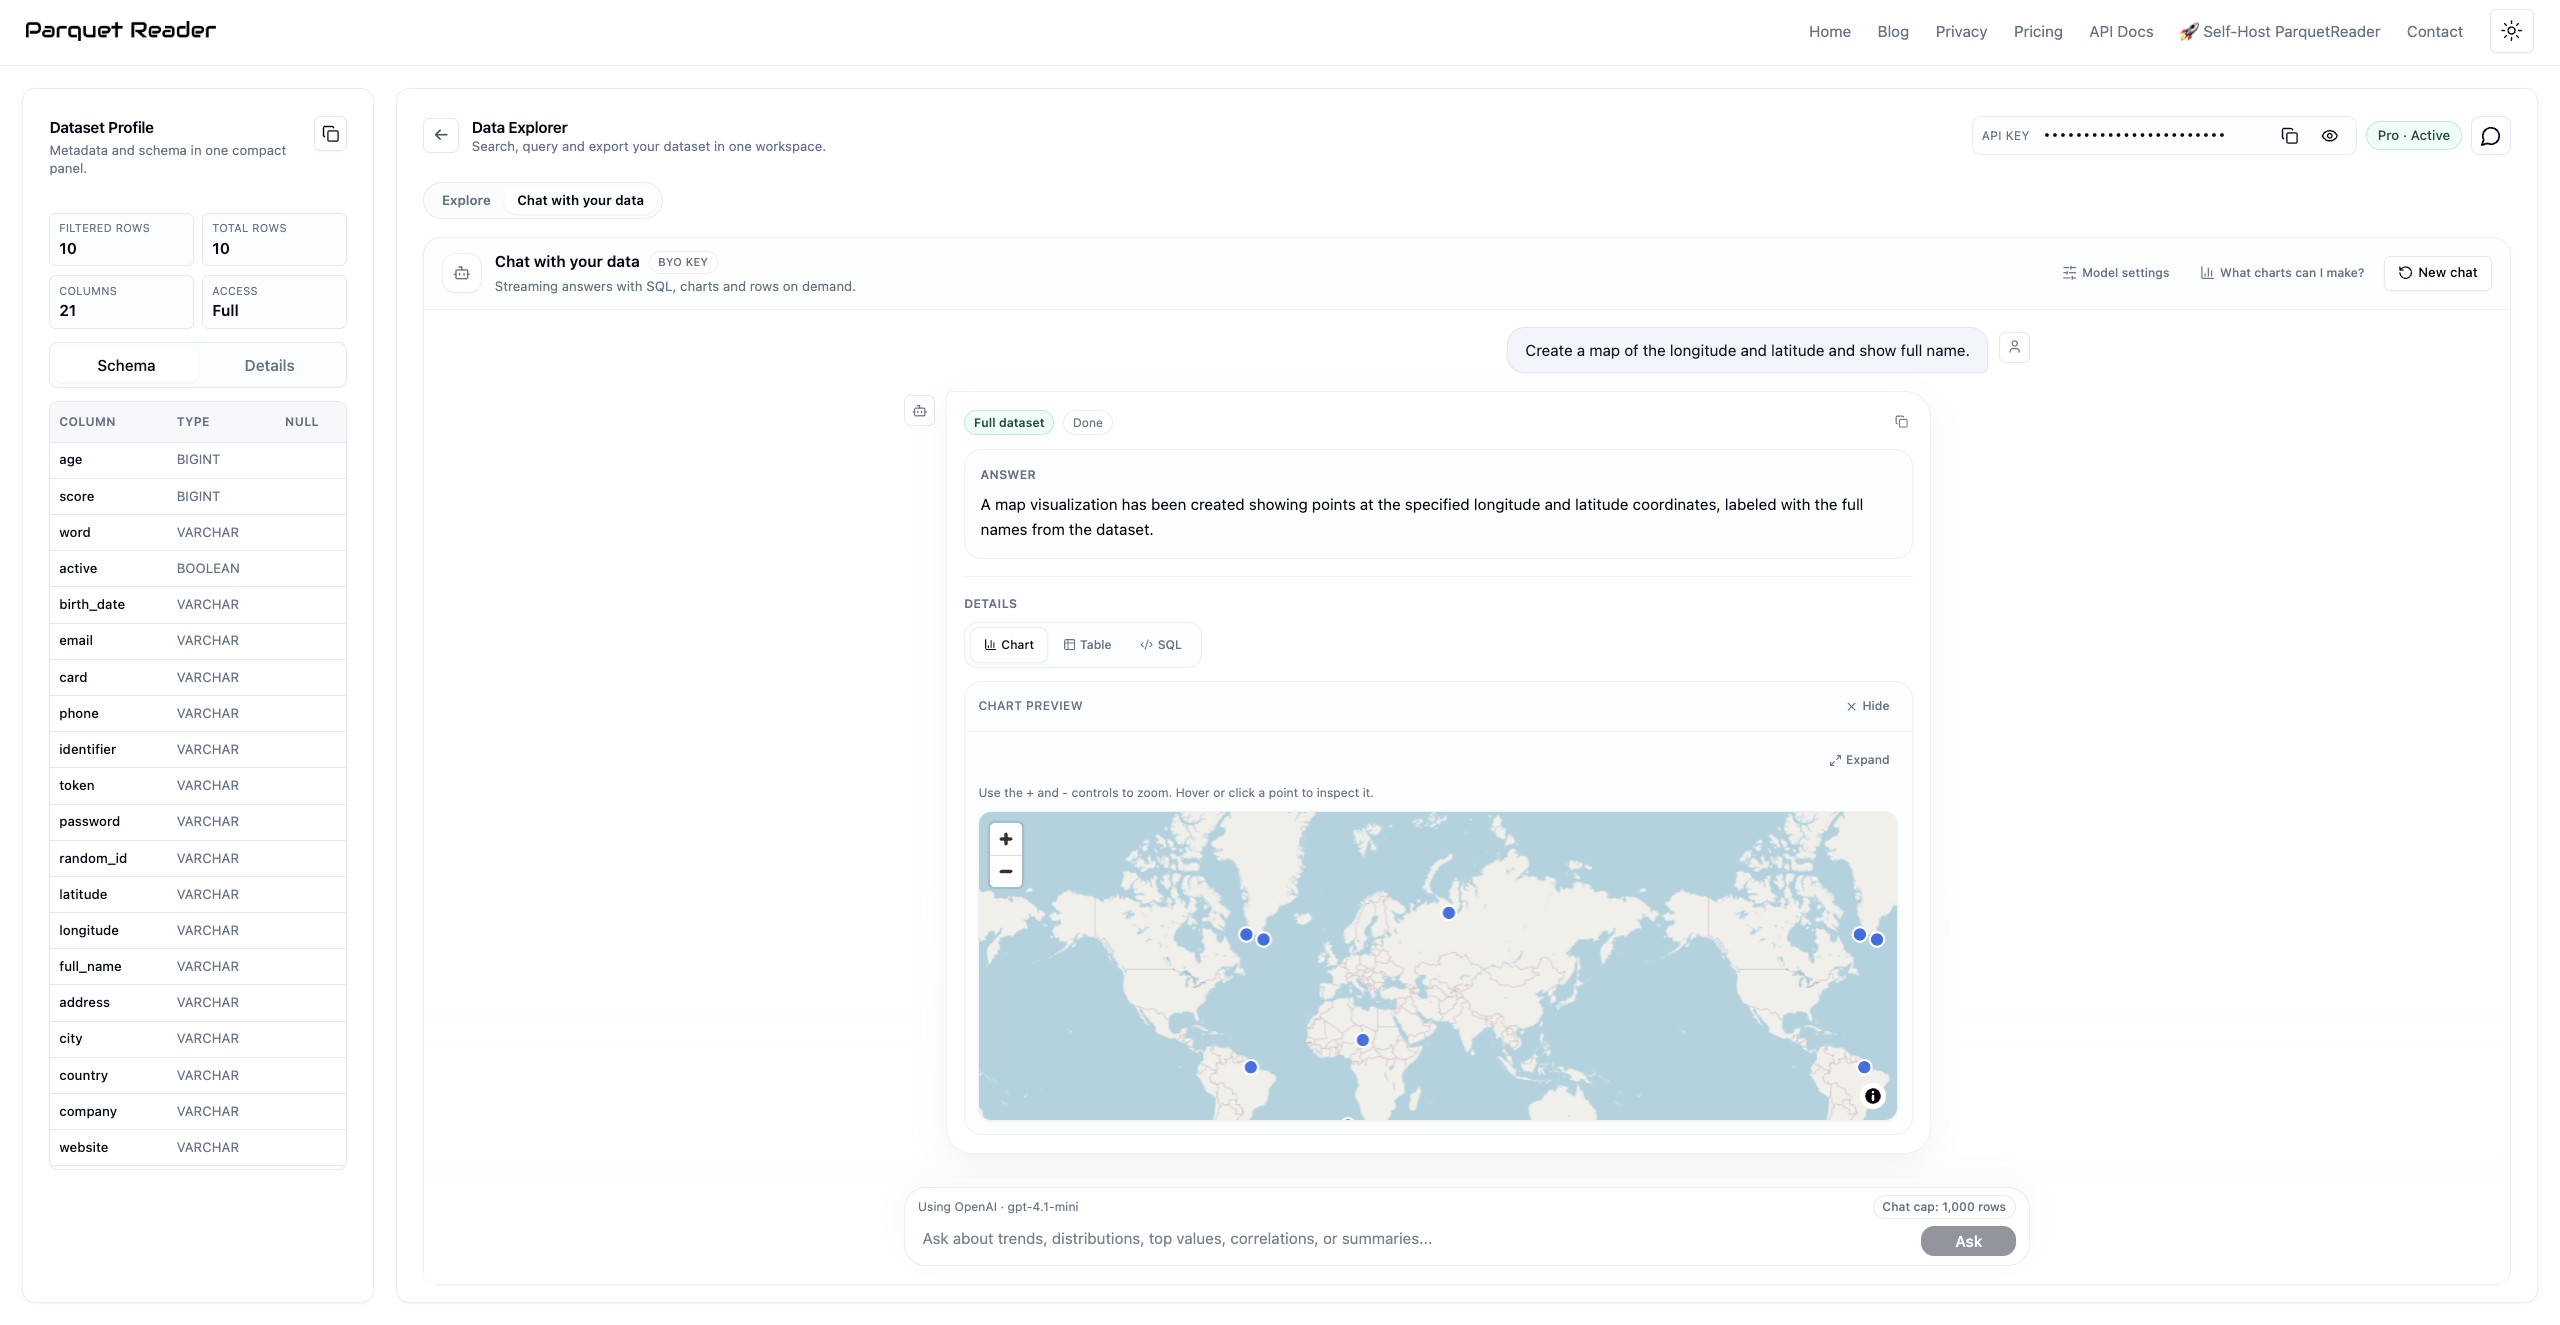
Ask naturally. Get SQL and charts back.
The point of the feature is not “AI for AI’s sake.” The point is faster analysis. Ask for a map, a trend, a top-value summary, or a distribution, and ParquetReader turns that into a result you can inspect.
The answers are paired with the generated SQL and the underlying result tabs, so the workflow still feels like a serious data tool rather than a black box.
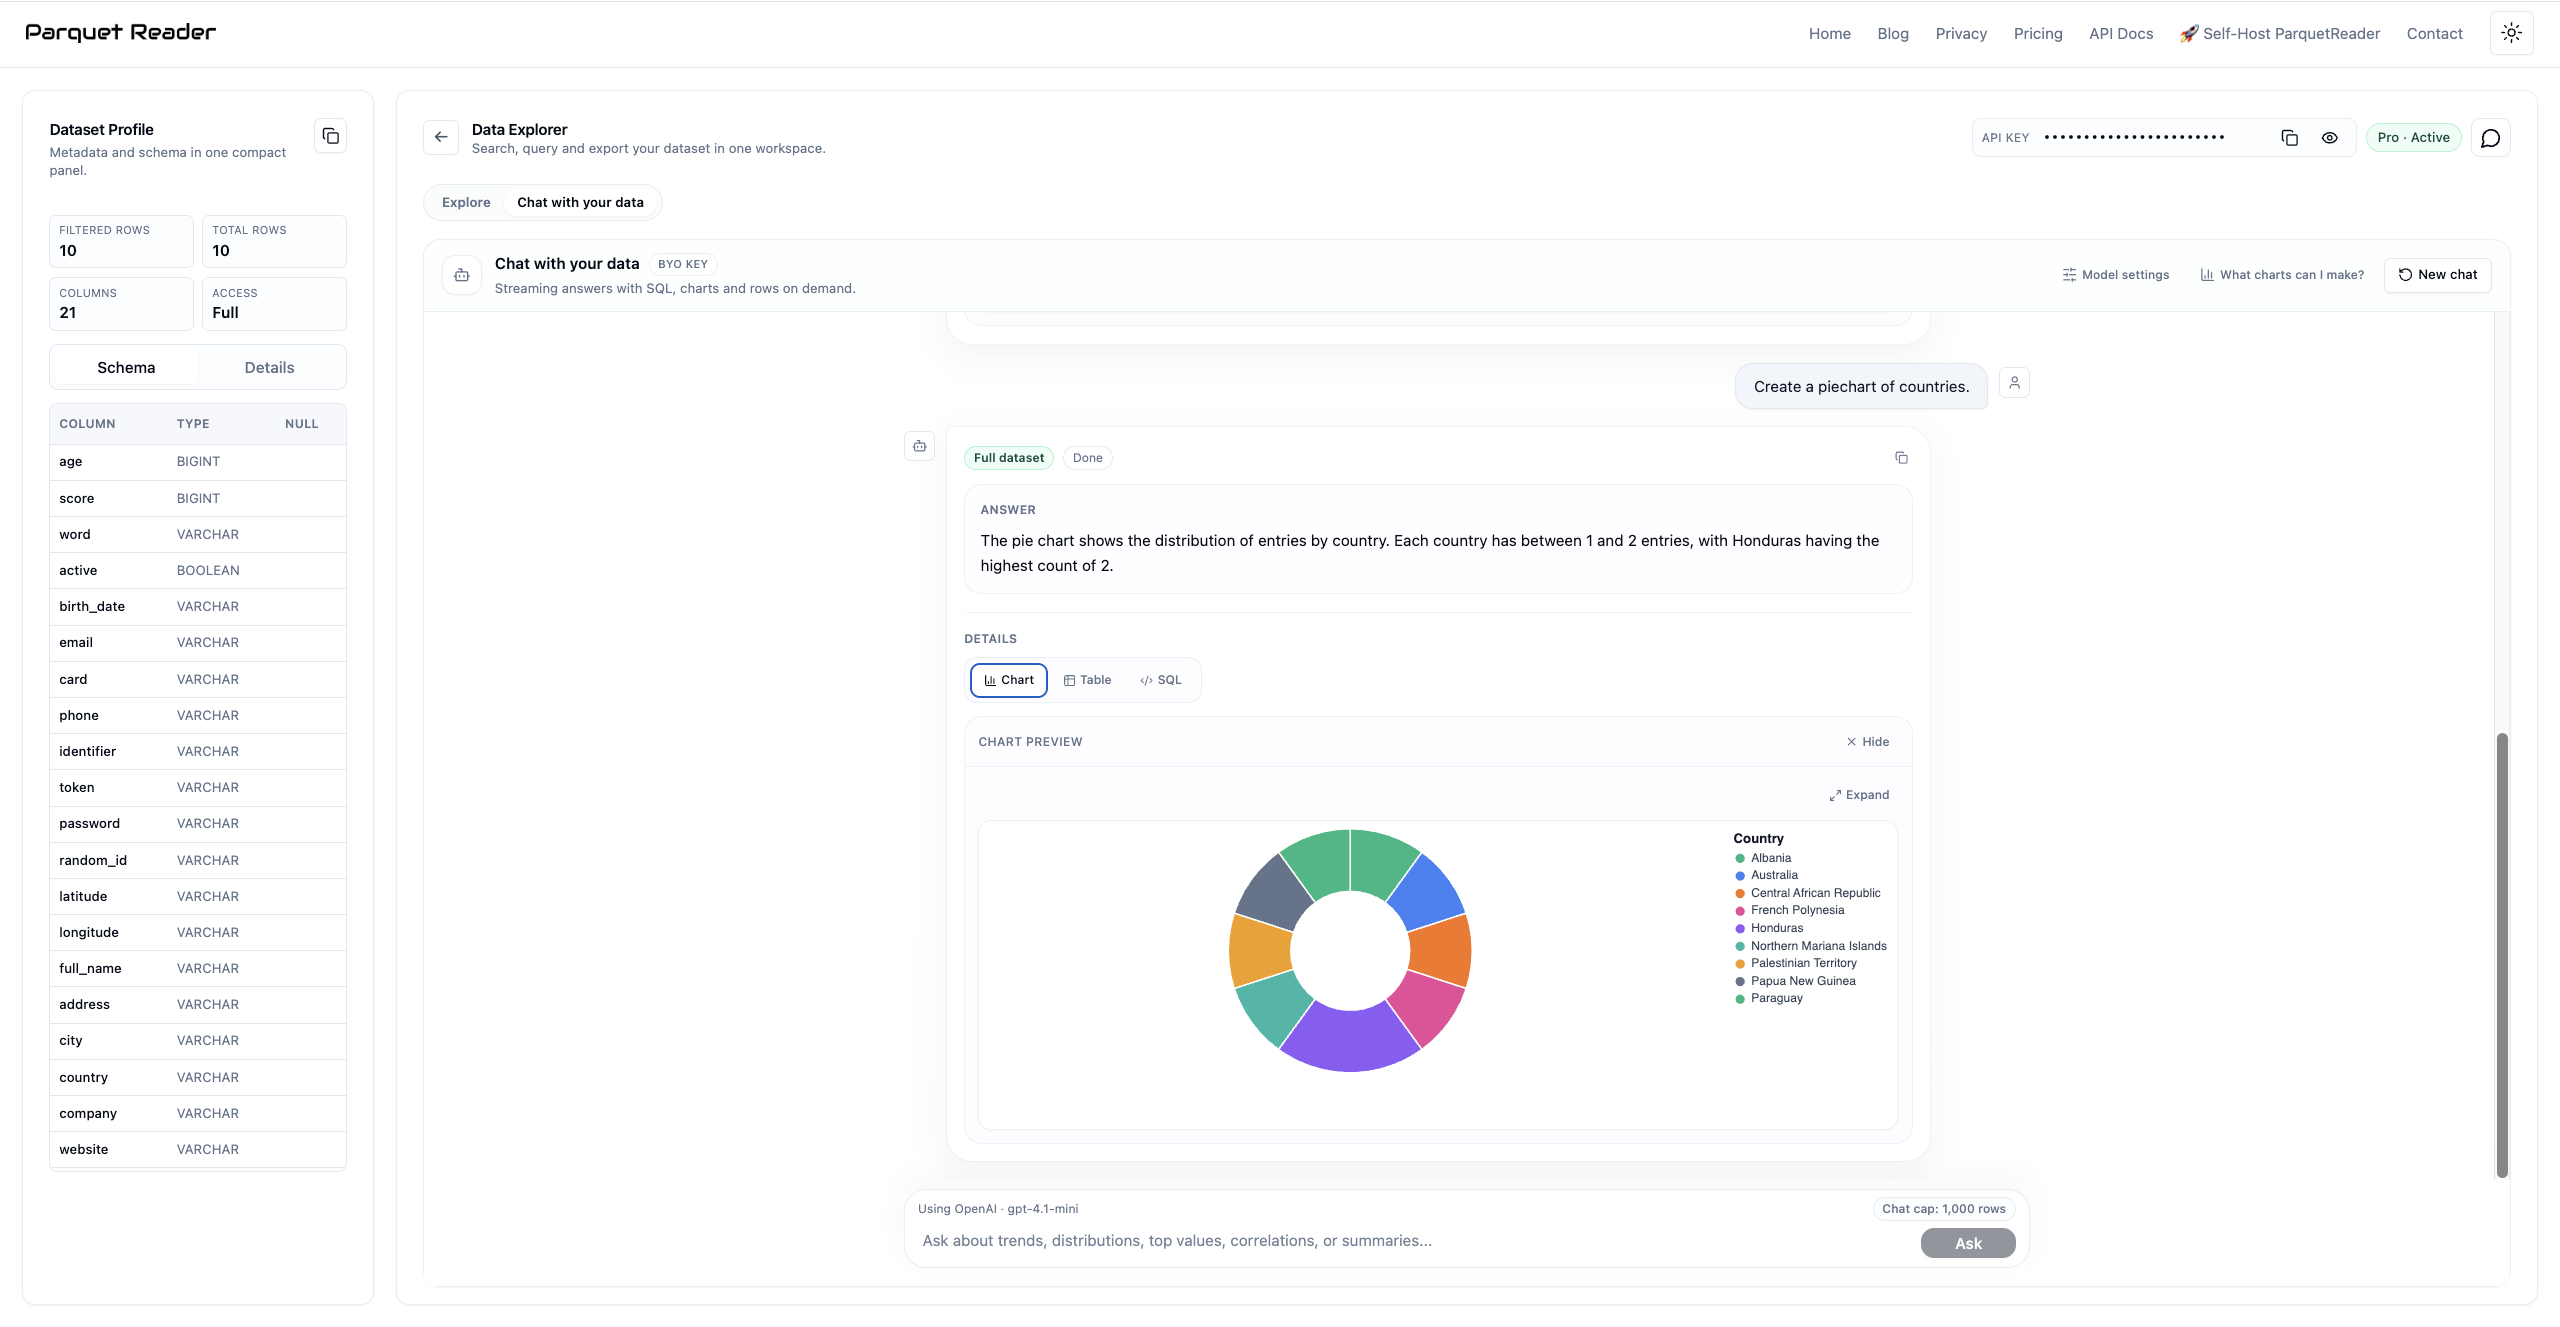
From distributions to dashboards-in-progress
Some questions are about structure: which countries appear most, which categories dominate, which segment is growing, what should we look at next.
That is where chat becomes a much faster front door to the data. You can move from “make a pie chart of countries” to concrete follow-up questions without leaving the explorer.
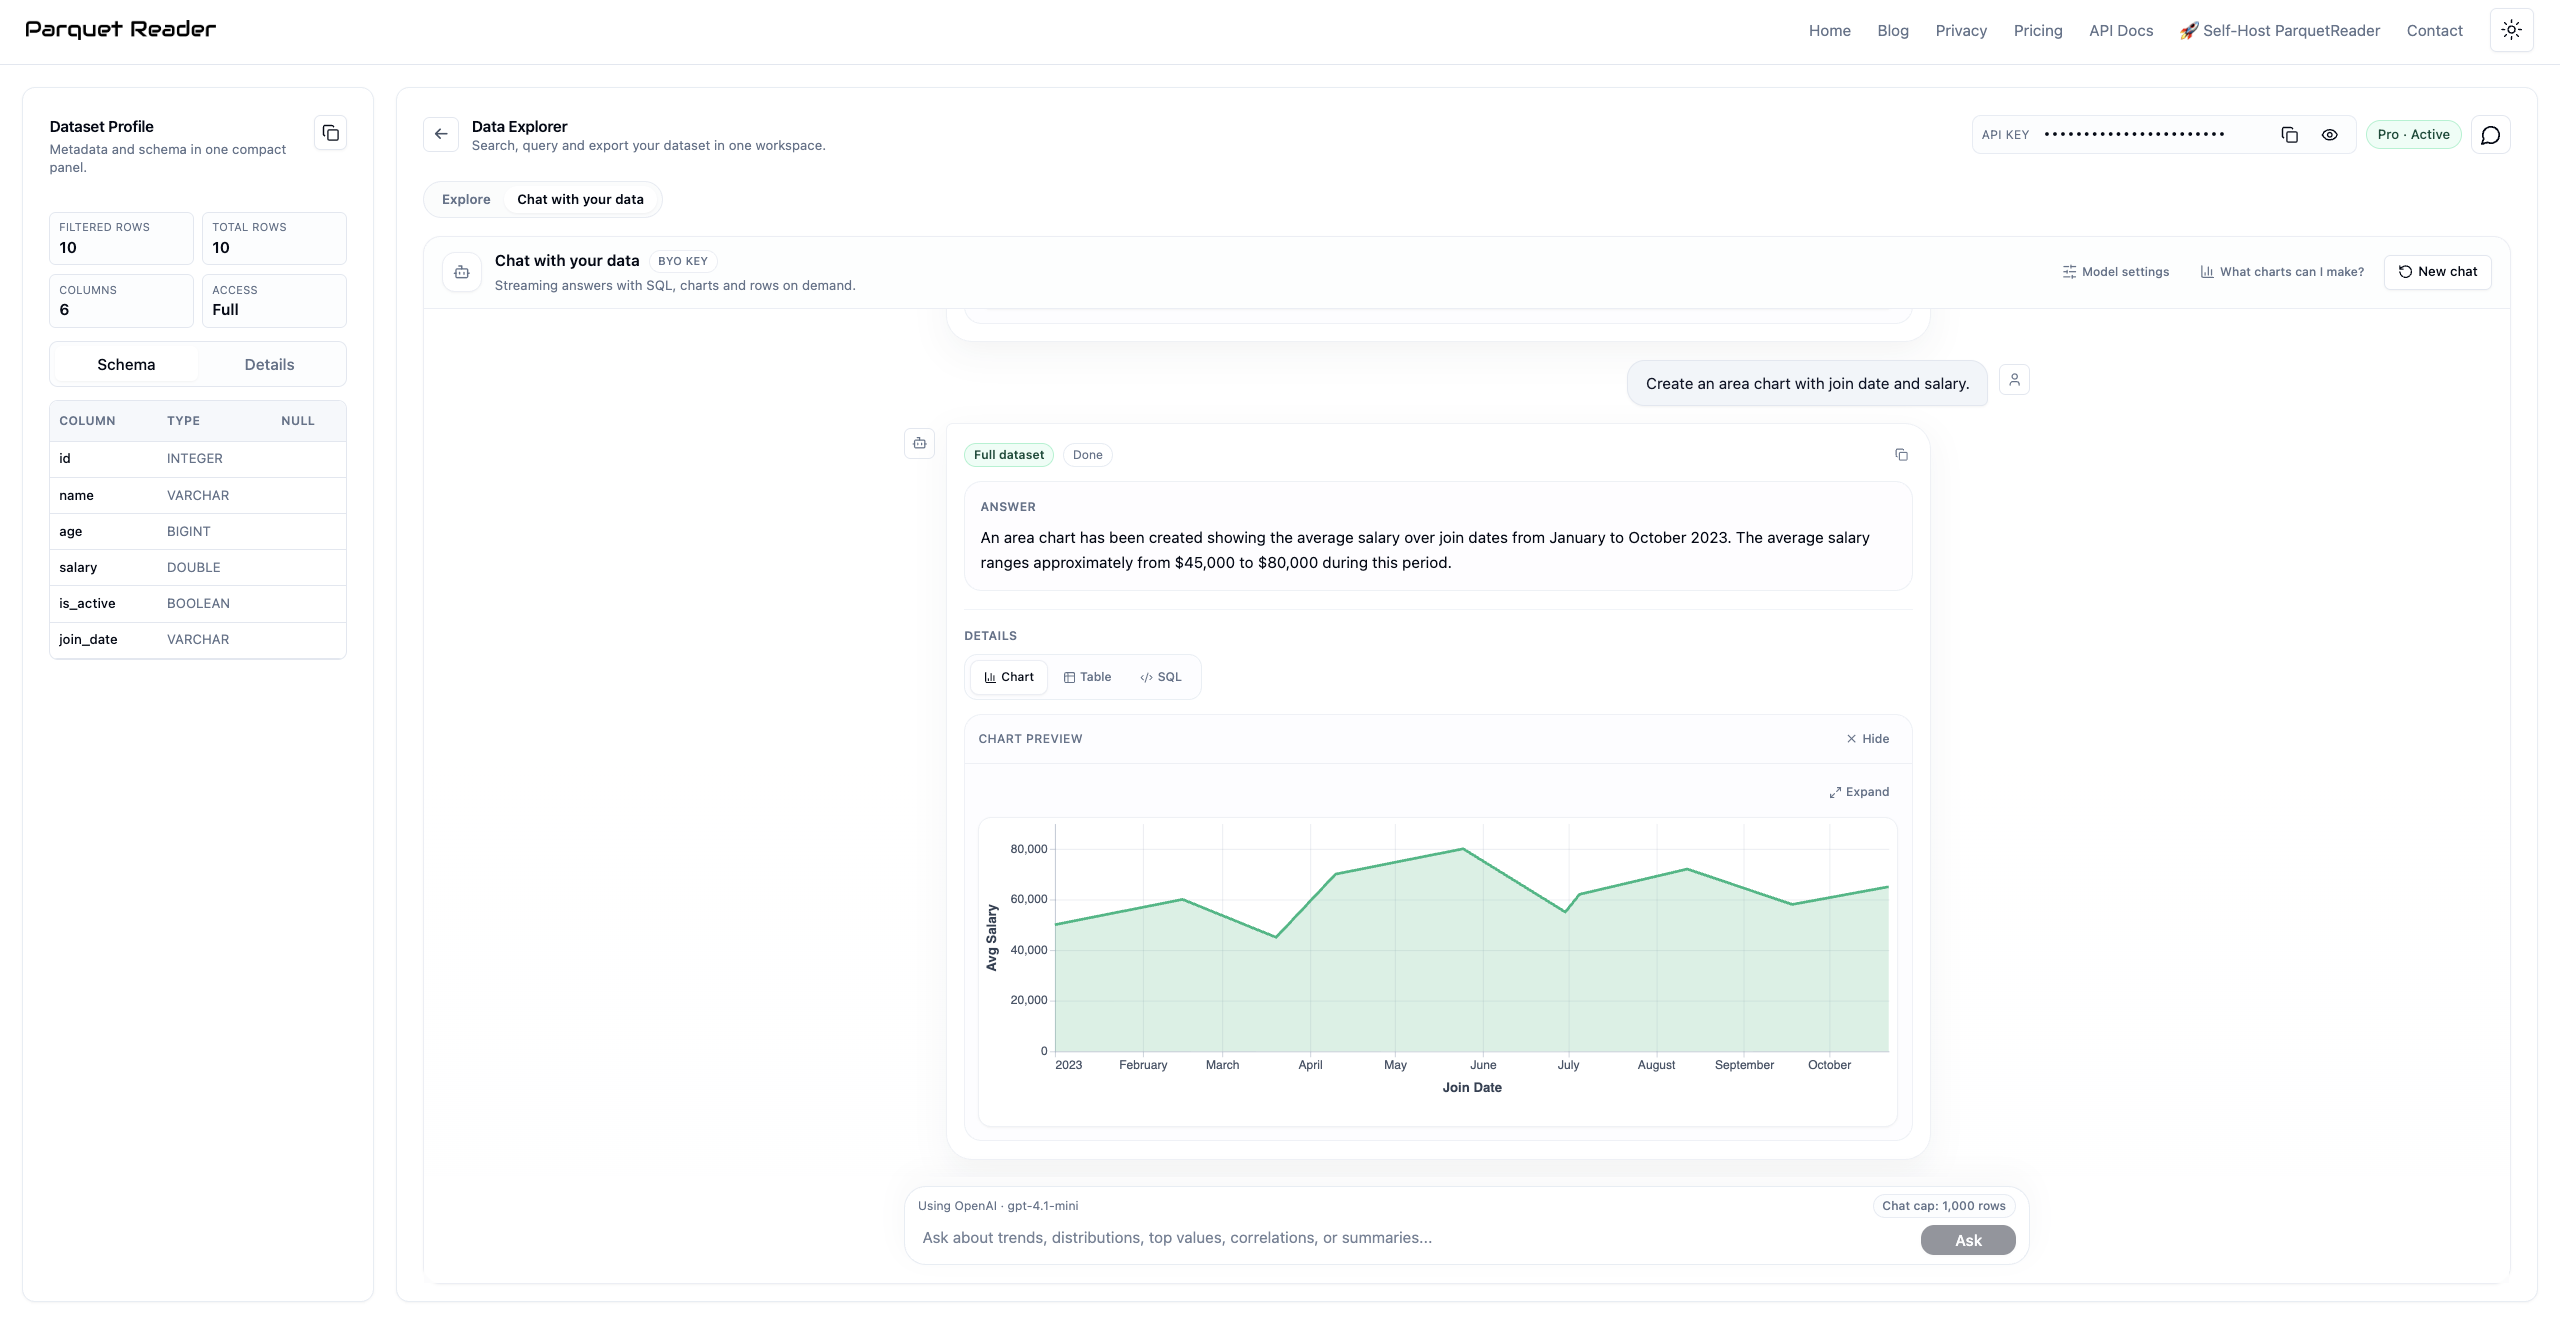
It also works beautifully for trends over time
Chat is especially useful when you already know the business question but do not want to handcraft the first query. Ask for an area chart, a line chart, a comparison, or a summary over time and keep iterating from there.
This is where “chat with your data” starts to feel less like a gimmick and more like a serious analysis accelerator.
Why this matters
Most file tooling still makes you choose between a dead-simple preview and a fully manual SQL workflow. Chat with your data closes that gap.
You can start with a question, inspect the generated result, open the SQL, and keep going. It is faster for analysts, friendlier for non-SQL users, and still transparent enough for technical teams.
If you only need a quick try, start on the free preview. If you want reliable full-dataset answers, unlock full access and keep chatting over all your data with your own model key.
Try it now
Ready to talk to your data?
Upload a file, connect your model, and start asking questions across Parquet, Avro, Feather, ORC, CSV, GeoJSON, NetCDF, JSON, Excel & Arrow.